Greetings and welcome to the blog!
Today I want to talk a bit about CLSLogging setup. CLSLogger is part of the Skype for Business debugging tools, in its full splendor known as Centralized Logging Service. This tool logs your Skype for Business activities, including SIP traces.
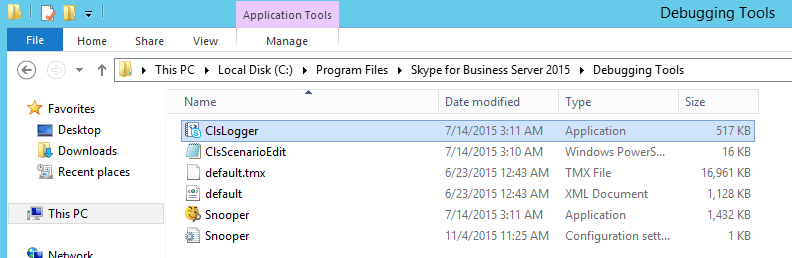
Once you’ve downloaded and installed this on one of your servers, you’ll find the executable at “C:\Program Files\Skype for Business Server 2015\Debugging Tools”. CLSLogger can be run against Lync 2013 and Skype for Business Servers, but NOT against Lync 2010 or older. Seriously, if you are on 2010 or older, give us a call, we can help you upgrade.
Installed along with it is a new version of Snooper. This is a personal preference, but I always create shortcuts to both CLSLogger and Snooper on the desktop, because having to browse to the folder every time I want to run it gets to be a little annoying.
To kick off CLSLogger, right click and run as Administrator. If you don’t do this, you’re going to get errors and things won’t work the way you want them to. Remember, this is really nothing more than a pretty GUI for the CLSLogger PowerShell Cmdlets.
After you’ve kicked it off, here’s what you’ll see:
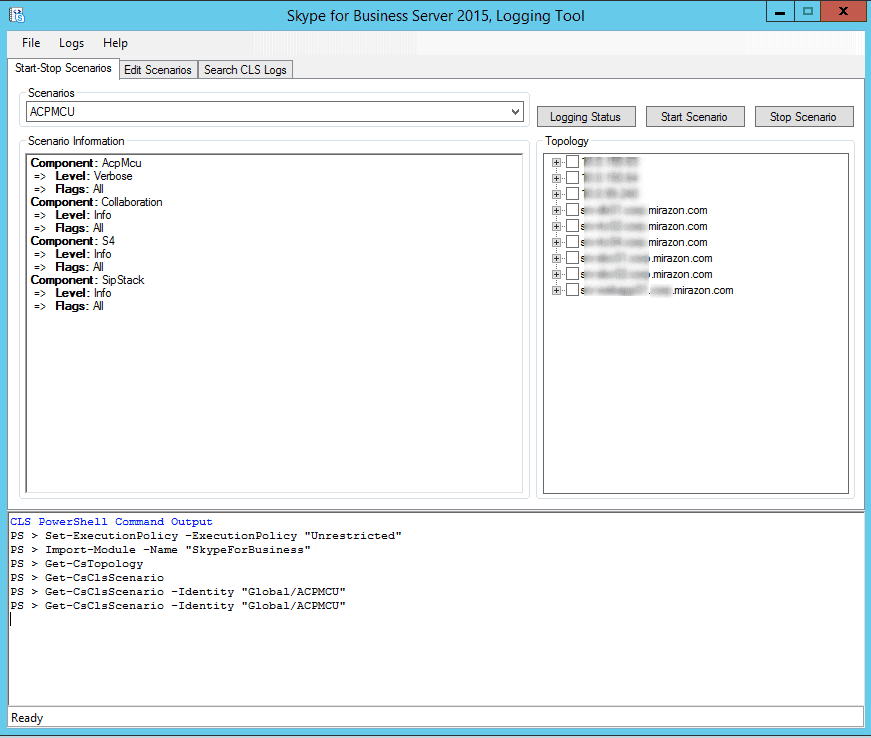
A lot of this is fairly self-explanatory but in the interest of this blog post, I’ll walk you through some of the key items here. There are three main parts to this first window, the scenario information, the topology, and the output pane.
The scenario information pane shows which items will be logged for the selected scenario, the selected scenario being conveniently chosen by way of the rather cryptically labeled “scenarios” dropdown. These scenarios were hand-crafted by warrior monks living in caves hidden deep beneath Redmond. Each one has a predefined set of components, taking away a lot of the frustration of having to select each individual component that you want to log.
For those of you who don’t trust warrior monks, you see those tabs at the top? Click the Edit Scenarios tab at the top and, well, you can edit the scenarios. Yeah, I know, you weren’t very surprised. So sue me.
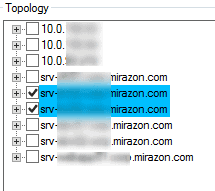
The topology pane has everything in your topology (which makes sense as you can see in the output pane that it actually ran Get-CsTopology), from Front Ends, to Edge servers, to Gateways to WAC servers. This does NOT mean that you can run logging against your non-SFB / Lync servers / components, so don’t get all excited. If this article draws the attention of the brilliant minds that developed this, maybe they can explain to us why it bothers to include these devices instead of just filtering for the actual SFB / Lync Server components.
Finally, the output pane. Again, fairly self explanatory here. As this is a GUI for the actual Cmdlets, here’s where your output is going to be. Oh, and before you go and try to resize this pane, I’ll save you the trouble. You can’t, no matter how carefully you move your cursor to try and get the resize arrows, you’re stuck with the size they defined. This usually isn’t too bad, but sometimes there’s more output than can fit in that 13-line-tall box. Bonus, though, you CAN copy from the output pane, so it’s not all bad.
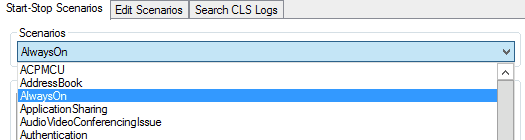
From the Scenarios drop down, go ahead and choose AlwaysOn.
This scenario is the one that I prefer to use when going live in an environment, and I usually will leave this running when I hand off to the IT staff. “But, RUSS,” I hear you say, “if you leave it running, you’ll fill up the hard drive and the server will crash and the world will end!” Relax. Those same warrior monks have you covered. Check this out:
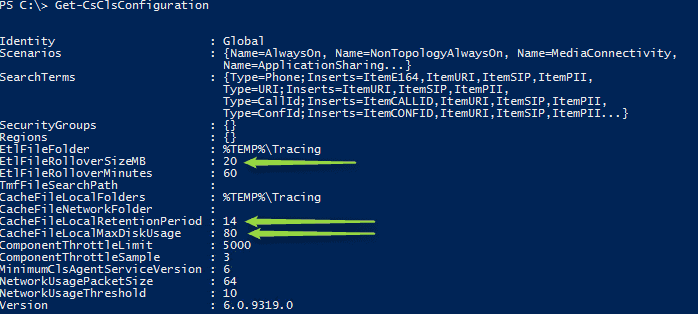
They have you covered. So what I ran there is Get-CsClsConfiguration. This shows the Global CLS Configuration. If you want to find out more about what each attribute is for, I recommend checking out the TechNet article for Set-CsClsConfiguration, but I’ll at least throw you a bone and explain the three I pointed arrows at.
- EtlFileRolloverSizeMB controls the maximum size for the event trace log file. Once it hits this size, it’ll go and create another file.
- CacheFileLocalMaxDiskUsage kind of explains itself. This is the percentage of the disk that you’ll allow the cache to take up. Default is 80%, you may or may not want to adjust that.
- CachFileLocalRetentionPeriod is how long the system will maintain cache files on the local machine.
Once you’ve chosen the scenario you want to run, choose what machines you want it to run on.
Just remember, this only will run on servers with the SFB / Lync 2013 bits installed on them. Click “Start Scenario” and wait for magic to happen in the background. What it’s doing is kicking off the CLS service on each of the selected machines, firing up the selected scenario on those machines, and, if needed, creating the log folders that are specified by Get-CsClsConfiguration.
This is another big advantage to CLSLogger over OCSLogger. Before, you had to run it on the server you wanted to get logs from. This was a giant pain in the derriere when you had an enterprise pool and you’re trying to troubleshoot anything. Now it’s centralized. I guess that’s why it’s the Centralized Logging Service… yeah…
Anyway, we’ve now got the Always On scenario running and we want to take a look at the logs that got pulled. Click that “Search CLS Logs” tab like you’ve been dying to the whole time.
![]()
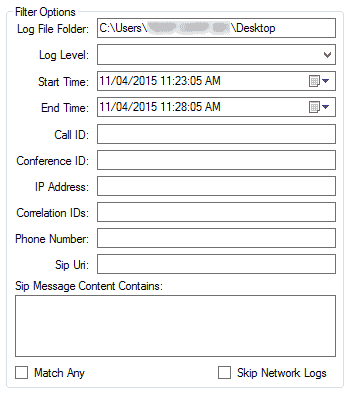
The Search CLS Logs tab gives us four panes to focus on. Two of them you’re familiar with, the topology and output panes. But on the left we get something pretty new…. We have filter options! Yes, ladies and gentlemen, we can now specify what we are looking for in the logs BEFORE we analyze the logs!
Just look at all those filter options! Go ahead, take a moment to take it all in. I can wait.
Done? Good! Let’s move on.
The Log File Folder is where it’s going to dump its output after you hit that Search Logs button over there.
Log Level is exactly what it says. What level of logging do you want output to that log file you’re about to create? Here are your options:
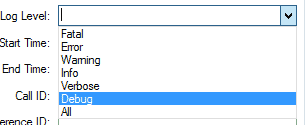
If you don’t choose something from this drop down, it defaults to ALL.
As I said before, I prefer the Always On, and I guess this is as good a time as any to explain why I prefer Always On.
One of the biggest drawbacks that I found with OCSLogger was that it depended heavily on being able to reproduce an error.
Example: Jimbob from accounting occasionally has an issue with his calls being disconnected. This doesn’t happen all the time, in fact it’s maybe once a week, never to the same person, entirely unable to reproduce on demand. With OCSLogger, we start it and pray we don’t fill the hard drive with logs before Jimbob reports that it happened again so we can stop logging as quickly as possible, or hopefully he reports it quick enough before our circular log file overwrites itself and we lose the data.
Now let’s take that same scenario but apply CLSLogger. We kick off the Always On scenario after go-live and it’s been quietly churning along in the background. Don’t believe me? From the “Start-Stop Scenarios” tab, choose a server in the Topology list and click that “Logging Status” button up there.
Check the output pane:
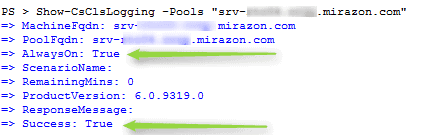
So we get a call one bright summer day from Jimbob. At 9:30 this morning, he was on the phone with his pet sitter and his call disconnected just before he could ask how Fluffy was doing. Since we already had logging running, we don’t have to go through the motions to reproduce the error. It has already been logged and we can search the logs.
…Which brings me to the next part of the Filter Options: Start Time/End Time. Yes, you can now just search in a time range instead of dump the whole dang log file and begin the endless scrolling to find the time stamp. For Jimbob’s issue at 9:30, you can set a start time of 9:25, end time of 9:35, and now you’ve only got 10 minutes of logs to dig through, not hours.
As if it couldn’t get any better, check out the other options you can filter by, specifically check out Phone Number and SIP URI:
Go ahead and filter that bad boy by Jimbob’s SIP URI and now you’re only looking at 10 minutes of Jimbob’s activity. I can totally feel your excitement from here!
The next pane is the Components. From here, choose the components you want to take a look at.
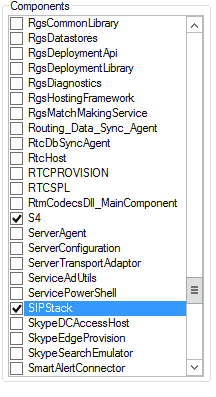
As I’m sure you’ve already guessed, if you check it, you’ll get logs on that component. Choose the servers that produced the logs you want to search and then hit that Search Logs button.
A little word of caution as this is a problem that I’ve found and I hope they (Hear that, Redmond Warrior Monks? I’m talking to you!) will address in future releases. When you hit the Search Logs button, it’s going to sit there and go through the logs that it’s taken to produce a log file that meets the requirements and filters that you’ve set forth, and that process can take a little while to happen. That’s not the problem, though. I expect that to take a while. The problem is the naming convention of the log file. It outputs to the specified folder CLSLog-<Servername>-<Component>-<Log Level>-<18 digit number that might mean something>.txt . So, the results from the screenshots I’ve shown would be something like CLSLog-srv-blurredoutservername.www.mirazon.com-S4-SIPStack-All-635822335249897385.txt. Heaven forbid you are looking at a lot of components like the last time I was looking at RGS issues. You can very quickly wind up with a log file whose name is so long that it exceeds the file name length allowed and it bombs out trying to save the file. Just so you’re aware, be careful of that.
So once you’ve hit the Search Logs button, and it’s done its thing, you’ll get a popup much like this:
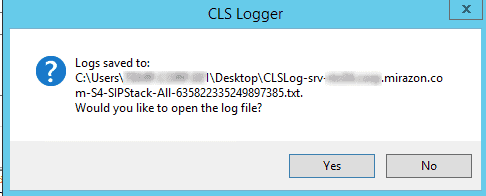
For the love of all that is holy, do not click yes! Well, I guess you can, if you’re looking for an excuse to get some coffee, because the default action is to open this with Notepad. I have no clue why, but if that’s a big log file… well, we’ve all done stupid things, we understand.
Instead, click No and head up to the top where you can click “Logs” and then “Open Logs with Snooper.”
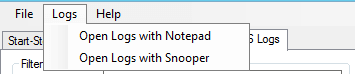
Why this isn’t the default action, I have no clue. Again, Warrior Monks… come on, guys.
Once you’ve got it open with Snooper, you can still do any searching or filtering as you see fit in there. The addition of pre-analysis filtering makes it pretty handy dandy, not to mention the ability to essentially look at logs after the failure happened without the need to reproduce the failure will keep you from having to chase quite as many ghosts.
That’s it for this edition. As always thank you for reading, and all comments, concerns and snide remarks are welcome, just shoot me an e-mail, find me on Twitter @pyruvi, or berate me on LinkedIn. Until next time!